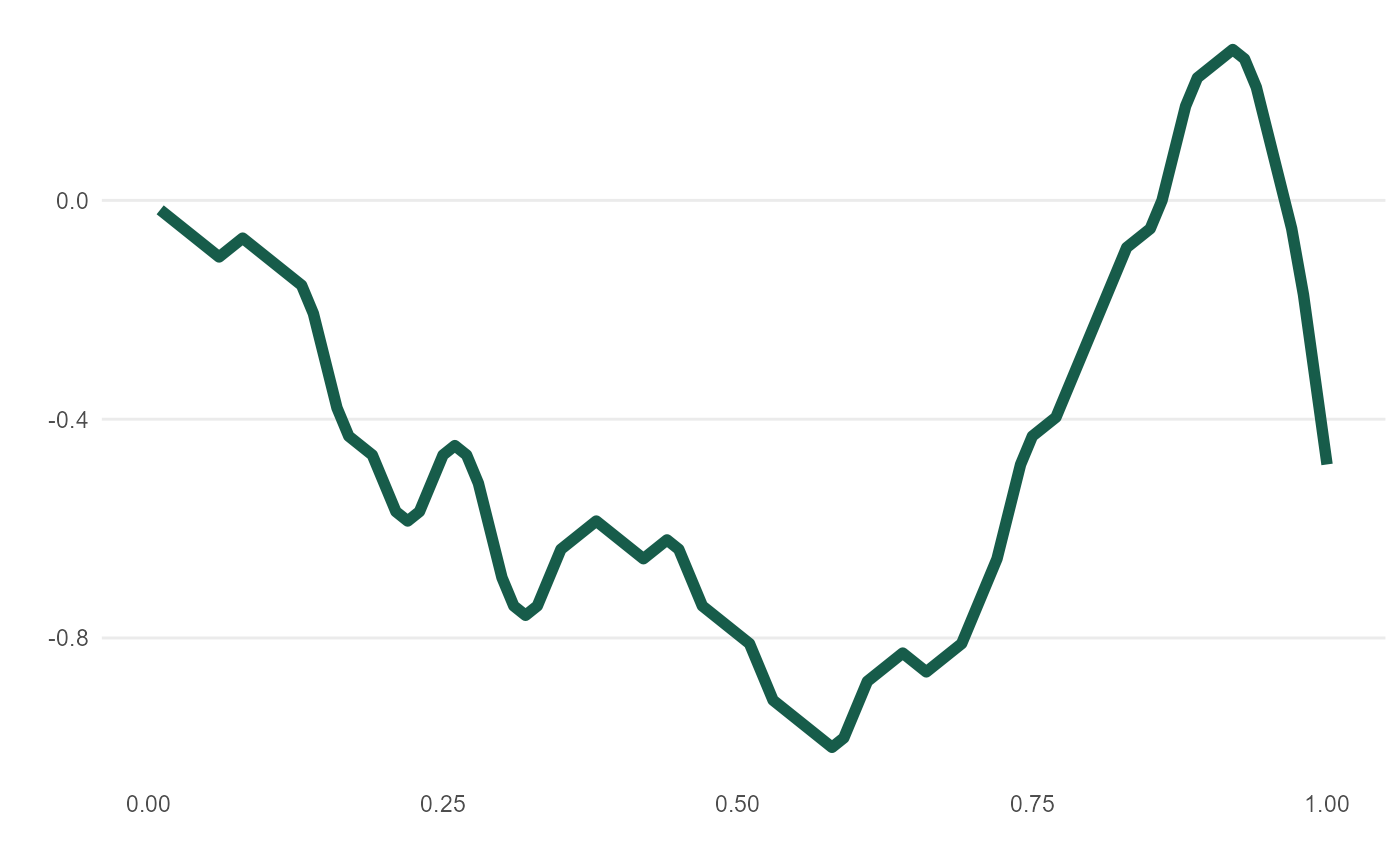
Create simply line plot from x + y coordinates. Designed for `meandr` but can be used in other applications.
Source:R/mplot.R
mplot.RdCreate simply line plot from x + y coordinates. Designed for `meandr` but can be used in other applications.
mplot(.df)
Arguments
| .df | A data frame containing at least two numeric columns. |
|---|
Value
An object of class `gg`